Quantifying the Drivers of Mall Foot Traffic: Marketing Mix Modeling for a National Retail REIT
Overview
For a mall REIT, foot traffic is the leading indicator of the entire business model. The company doesn’t earn revenue from sales — it earns revenue from rent, and rent depends on retailer success, which depends on whether shoppers actually walk through the doors. For years, marketing decisions across the portfolio were made without a measurement framework that could quantify what was actually driving visits. I built one.
The work combined a novel data source (camera-based mall entrance traffic counts), a non-trivial data integration effort across eight marketing data sources, and a panel regression model that decomposed foot traffic into seasonality, weather, demographics, and marketing. The methodology produced a coherent answer to a question that had previously felt unanswerable: which marketing investments actually drove incremental visits, and which just looked good on click reports.
The findings shaped marketing investment decisions over the following year — expanded investment in email, paid social, and the digital mall property portfolio. Foot traffic across the portfolio increased by approximately 7% over the period that followed.
The Business Question
Mall REITs operate on an unusual business model. Unlike retailers, they don’t sell products. Their revenue is rent — paid by the retailers occupying the mall — and that rent is only sustainable when retailers themselves are profitable. Retailer profitability depends on foot traffic. Foot traffic, in turn, is influenced by a tangle of factors: weather, season, day of week, holidays, demographics, the local competitive set, and marketing.
That structure produces a specific strategic question. If marketing spend across the portfolio drives incremental foot traffic, then marketing is not a cost center — it’s a defense of the rent base. If it doesn’t, the company is spending real money on activity that’s decorative rather than load-bearing. The marketing leadership team needed to know which it was, channel by channel, with enough specificity to defend the budget to the CFO and to make better allocation decisions in the following year.
Several interlocking questions sat under that strategic one:
• Does paid digital media — search, social, display — actually drive incremental mall visits, after accounting for weather, seasonality, and day-of-week effects?
• How do CRM channels (email, SMS) compare to paid media in driving next-visit behavior?
• How much of observed foot-traffic variation is explainable by uncontrollable factors (weather, season, demographics) versus marketing?
• Do outdoor and indoor malls respond differently to weather and to marketing? If so, how should the planning model differ?
• Which investments should grow, and which should be reduced or eliminated?
The Data Problem That Came First
The hardest part of this project was not the modeling. It was the prerequisite question: we didn’t have foot traffic data to begin with.
Mall operators historically rely on rough proxies — parking lot sensors, anchor-store reports, occasional manual counts. None of these produces a clean daily series at the property level, which is what a marketing mix model requires. Without an outcome variable, no measurement framework was possible.
The breakthrough came from an unrelated source: a piece on how journalists and researchers estimate crowd sizes at large events using image analysis. The same approach — calibrated camera capture combined with crowd-density estimation — could in principle be applied to mall entrances. I shared the methodology with IT, who built and deployed an entrance-camera-based traffic counting system across the portfolio. That system became the foundation everything else rested on.
Worth saying clearly: the modeling work in this case study was only possible because the input-data problem was solved first. A meaningful share of senior data science work is recognizing when the bottleneck isn’t the model — it’s the data the model would need.
Why Existing Methods Fall Short
Standard marketing mix modeling assumes a relatively clean outcome series and treats environmental factors — weather, seasonality — as noise to be controlled away. For a national mall portfolio, both of those assumptions break.
First, weather isn’t noise. For outdoor malls, weather is one of the largest drivers of daily traffic variation. A discretionary trip to an outdoor shopping center on a 95-degree afternoon doesn’t happen. Treating weather as a nuisance covariate misses the reality that for a meaningful share of the portfolio, weather is the dominant signal — and the marketing signal lives underneath it.
Second, treating weather with raw temperature and precipitation flags doesn’t capture how shoppers actually behave. Eighty degrees in February is unusual and pleasant; eighty degrees in July is normal and unremarkable. The relevant variable is temperature relative to seasonal expectation, not absolute temperature.
Third, weather data is typically pulled from a single metro feed and applied uniformly across a portfolio. For a national operator with malls in different microclimates, that’s a meaningful precision loss — the weather a mall in San Diego experienced on a given day is not the weather a mall in Minneapolis experienced. Property-level weather, stitched by latitude and longitude, is a substantially better signal.
The Approach
Data integration
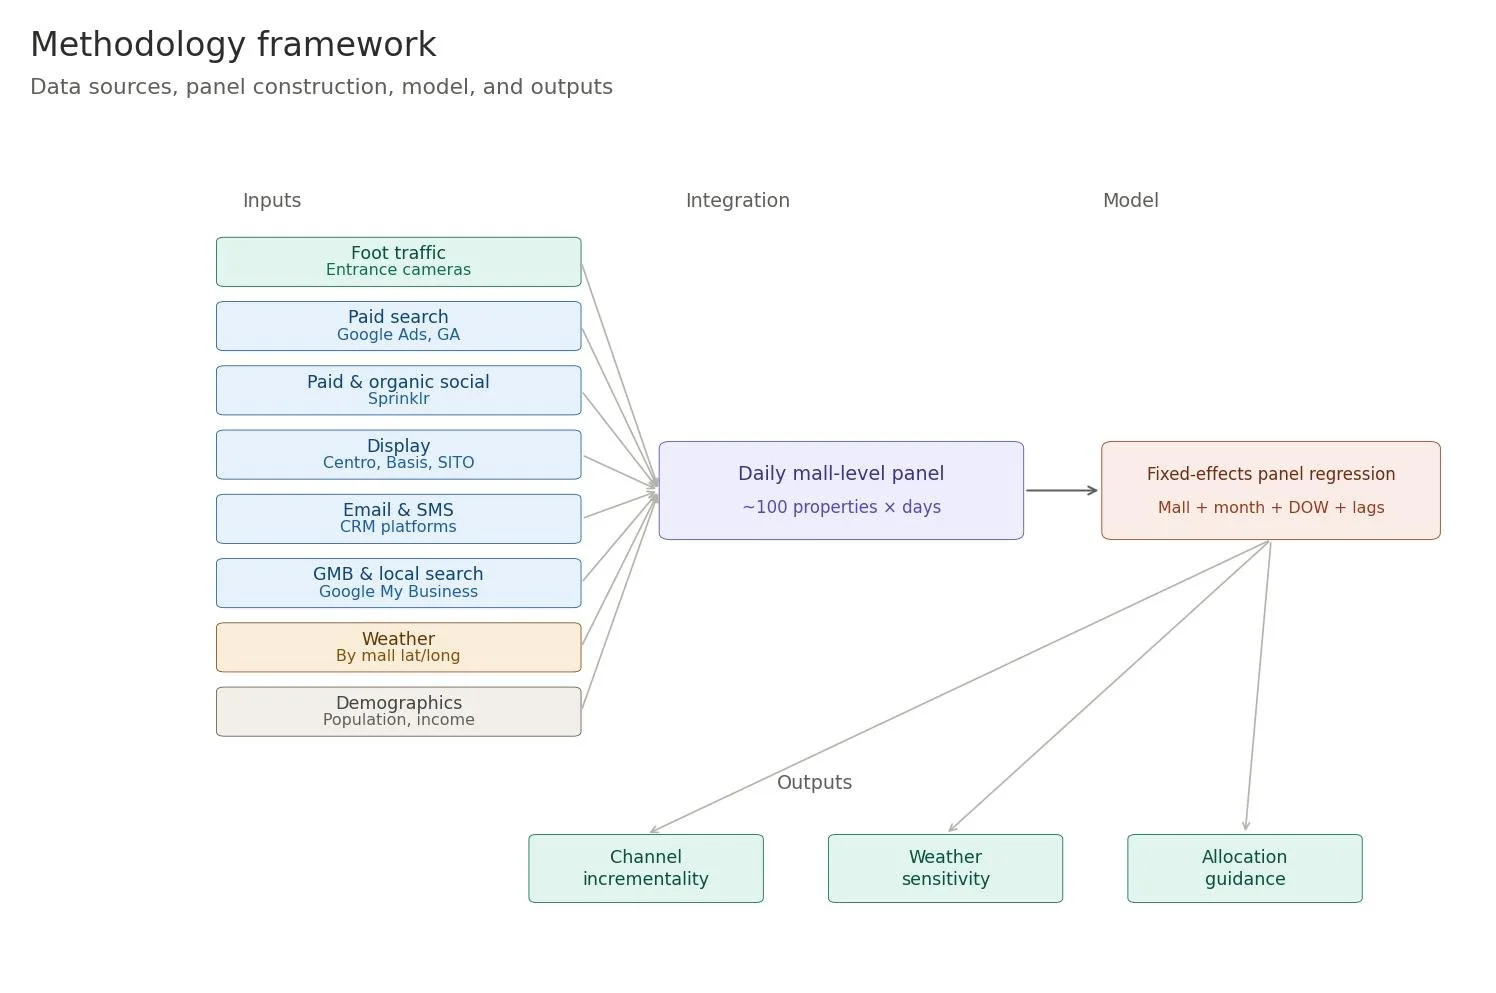
The model required stitching daily property-level data from a wide range of sources into a single panel:
• Foot traffic counts from the entrance-camera system (the outcome variable)
• Paid search impressions, clicks, and cost (Google Ads / Google Analytics)
• Paid and organic social activity, separated (Sprinklr)
• Programmatic display impressions and clicks (Centro, Basis, SITO)
• Email campaign sends and opens, SMS sends and unique clicks (CRM)
• Google My Business activity (impressions, direction requests)
• Radio impressions and special events (manual capture)
• Property-level demographics: population, average household income
• Property-level weather: daily high, low, average humidity, condition flags (fog, rain, snow, thunderstorm) — stitched by mall lat/long, not by metro
This integration was not trivial. Each source had its own update cadence, granularity, and identifier scheme. Building and maintaining the pipeline that produced the daily mall-level panel was a meaningful share of the total project effort.
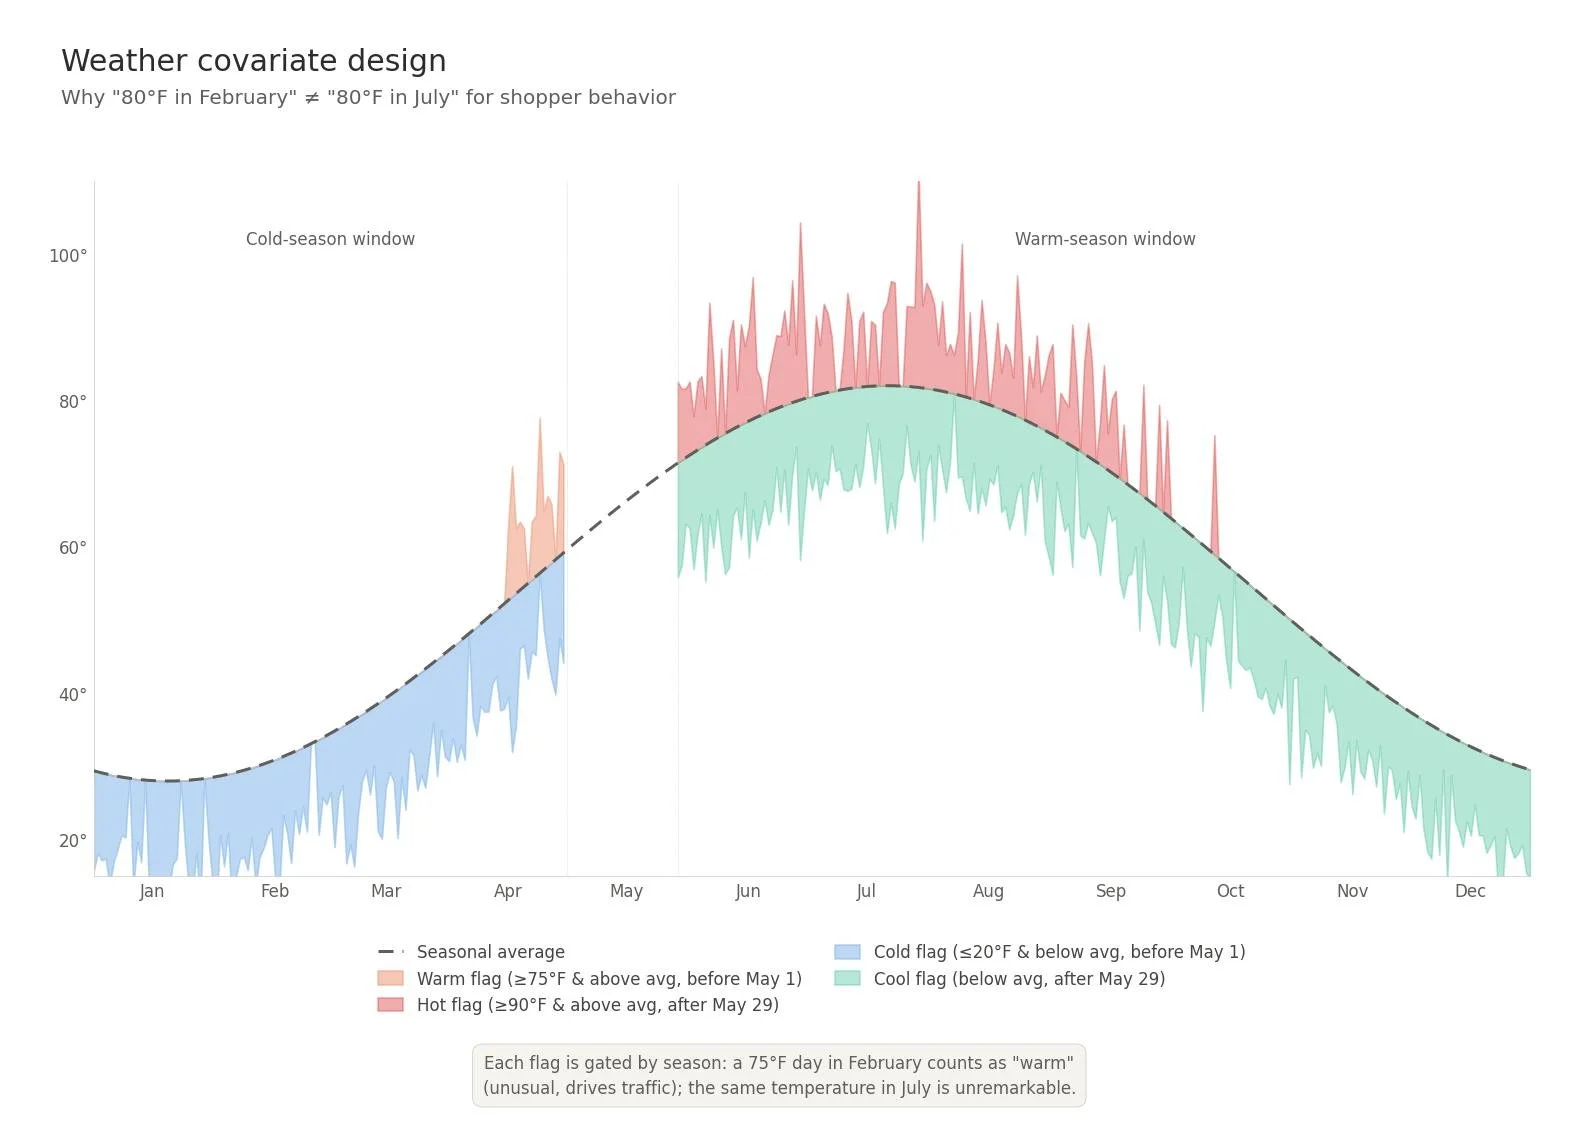
Weather covariate design
Rather than using raw temperature, the model used relative-to-seasonal-average flags:
• Warm: max temperature ≥ 75°F AND above the historical average for the date — but only counted before May 1 (when warm-weather is unusual)
• Hot: max temperature ≥ 90°F AND above the historical average — only counted after late May (when hot weather suppresses outdoor mall trips)
• Cold: min temperature ≤ 20°F AND below historical average — only counted before May 1
• Cool: cooler-than-average days during summer months
• Plus binary flags for fog, rain, snow, and thunderstorms
This design captures the behavioral reality: an unseasonably warm February day drives traffic; the same temperature in July suppresses it. Standard temperature regressors miss this entirely.
Panel regression with mall fixed effects
The core specification was a fixed-effects panel regression of daily property-level foot traffic on:
• Mall-level fixed effects (controlling for time-invariant property differences in size, type, market position)
• Day-of-week effects (Friday, Saturday, Sunday separately — the dominant intra-week pattern)
• Month effects (capturing seasonality)
• Holiday dummies (MLK Day, Valentine’s Day, Presidents Day, Memorial Day, July 4th, Labor Day, Columbus Day)
• Weather covariates as described above
• Demographic controls (population, total income)
• Marketing variables: same-day organic search traffic and direction requests; next-day email opens, paid social impressions, display clicks, and engagement metrics (capturing marketing’s effect on the following day’s visits, which matches the behavioral reality of how shoppers respond to marketing)
The next-day lag structure on marketing variables matters. A shopper who sees a Facebook ad on Tuesday is more likely to visit the mall Wednesday than Tuesday — they need to plan the trip. Modeling marketing as same-day mis-times the relationship and biases the coefficients.
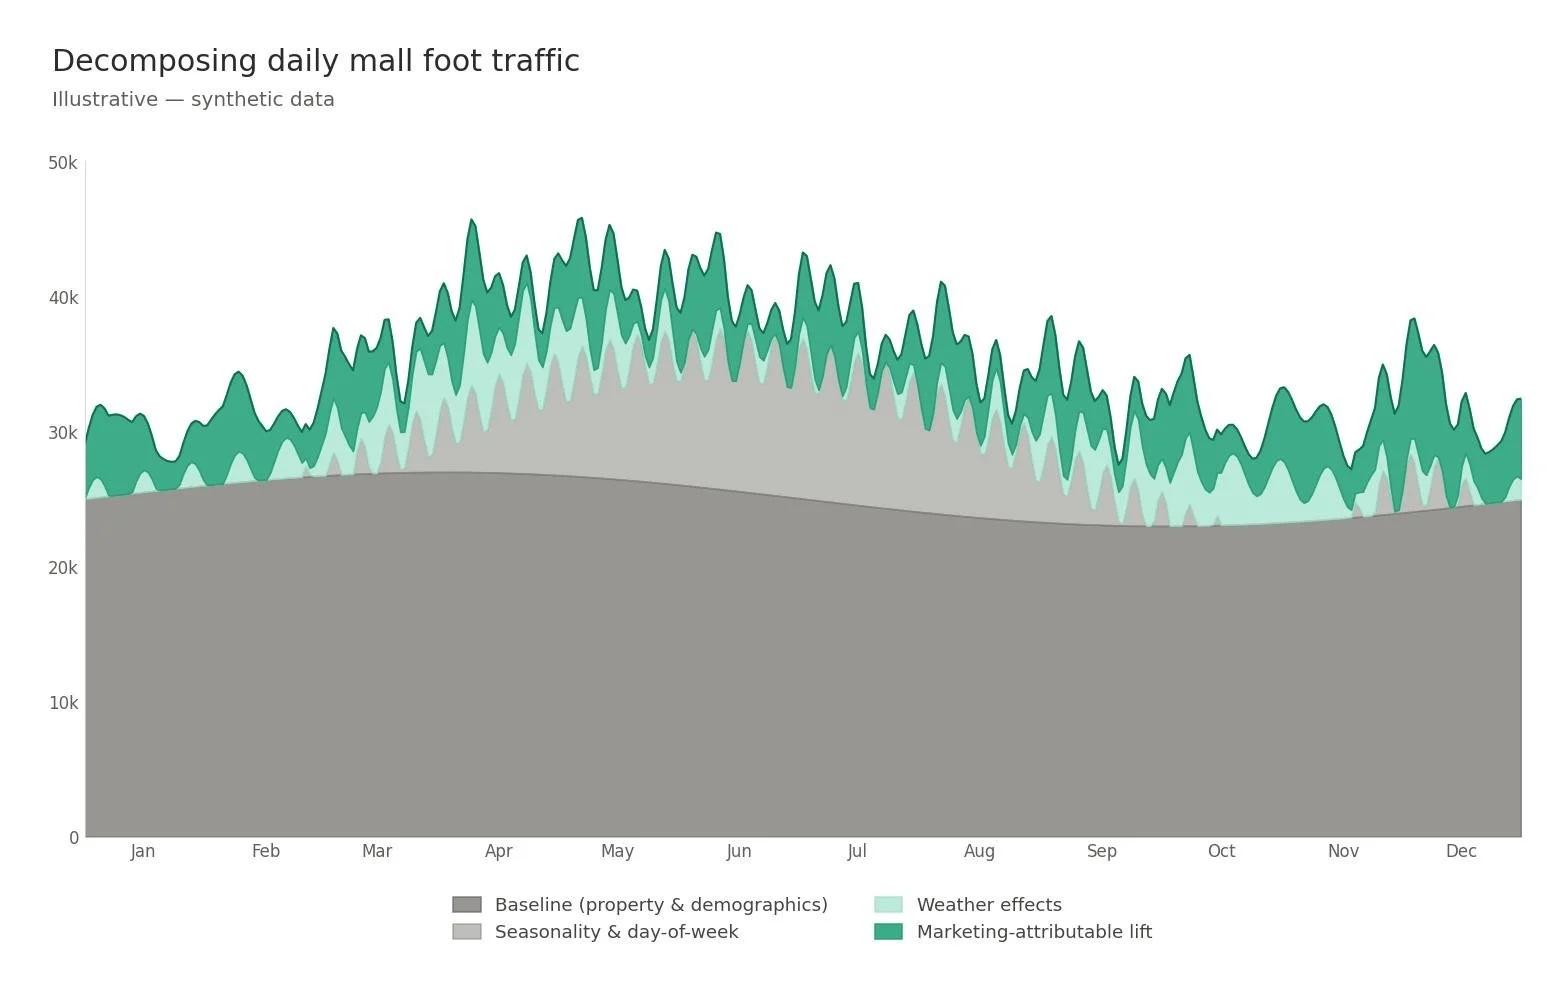
Key Insights
Weather and seasonality dominate, but marketing moves the needle on top. The combination of weather, day of week, season, and holidays explained the majority of foot-traffic variation. That is not a failure of marketing — it is a correct decomposition of reality. Marketing’s contribution is the incremental signal on top of the environmental baseline, and the model isolated it cleanly.
Outdoor and indoor malls behaved differently. Outdoor properties showed substantially larger weather sensitivities. Indoor malls were comparatively insulated. The implication for planning: marketing investment should be calibrated to property type, with outdoor malls receiving more weather-aware budget protection (i.e., not penalizing campaigns for performance during bad-weather periods that depressed traffic regardless of marketing effort).
Email and paid social drove next-day visits more efficiently than display. On a cost-per-incremental-visit basis, CRM channels (especially email) and paid social outperformed programmatic display. Display was generating impressions and clicks, but the model showed those clicks were not converting to incremental mall visits at the same rate as the cheaper, more direct channels.
Mall website engagement was a strong leading indicator. Organic search traffic and direction requests via Google My Business showed strong same-day correlation with foot traffic. This pointed to digital mall property investment — better mall websites, better local search presence — as an underweighted lever.
Business Impact
The findings shaped marketing investment decisions over the following year. The model didn’t produce a single recommendation — it produced a framework that allowed marketing leadership to defend specific allocation decisions with quantified incrementality estimates rather than channel-level intuition.
Investment expanded in the channels the model identified as most efficient. Email and paid social budgets grew. Digital mall property investment (mall websites, local search) accelerated, supported by the strong relationship between organic search and same-day visits.
Foot traffic increased by approximately 7% over the period that followed. This outcome reflected multiple inputs — the reallocation, broader marketing efforts, and external factors — but the model and its prescribed reallocation were a meaningful contributor to the lift.
Marketing’s strategic positioning shifted. Perhaps the more durable outcome was structural. The work reframed marketing within the company from a cost line to an instrument that defended the rent base by sustaining retailer foot-traffic conditions. That reframing changed how marketing was discussed at the executive level.
Why This Matters
Most marketing measurement at multi-property businesses stops at channel-level reporting: how many clicks did we get, what was the CPA. That level of analysis can’t answer the questions executives actually need answered — which channels drove incremental customers, how should next year’s budget be allocated, where is the marginal dollar best spent.
For a business model where the leading indicator (foot traffic, in this case) had previously been unmeasurable, the order of operations matters. Solve the input-data problem first. Build the integration pipeline second. Design covariates that match the behavioral reality of how customers actually respond. Only then does the modeling produce something defensible enough to drive budget decisions.
The methodology is portable. Any multi-property consumer business with a measurable outcome at the property level — retail chains, fitness studios, restaurant groups, healthcare locations, branch banks — can apply the same framework. The pipeline is reusable, the weather covariate design transfers cleanly, and the panel structure handles any property-fixed-effects setup.
Implementation
This methodology was implemented in R using fixed-effects panel regression. The data pipeline integrated eight marketing and contextual data sources into a daily property-level panel. Weather data was stitched property-by-property using latitude and longitude rather than metro-level feeds. Marketing variables were modeled with a next-day lag structure where appropriate to capture the behavioral lag between marketing exposure and shopping trip.