Creative Wear-Out and Cross-Campaign Halo: Quantifying TV's Effect on Paid Search to Shape an $8-Figure Annual Media Plan
Overview
Most conversations about TV advertising impact get stuck at two questions — "Is TV working?" and "How do we measure it?" — without producing decisions. I built an analytical framework that goes further. By connecting TV exposure data to branded paid search activity at the weekly level, I was able to quantify three things traditional approaches struggle to measure: how long a TV creative remains effective before its impact fades, whether running multiple creatives simultaneously amplifies response, and whether TV for one brand creates a halo effect on a related brand in the same portfolio.
The analysis was delivered to a major client ahead of their annual planning cycle. The findings directly shaped the following year's media strategy — including new investment in a channel that had not originally been planned.
The Business Question
The client was preparing to finalize the following year's media plan across a multi-brand portfolio. Several interconnected questions sat at the center of that decision:
- Does TV advertising actually drive measurable downstream activity — specifically branded paid search — or are media decisions being made on belief rather than evidence?
- When does a TV creative start losing effectiveness, and how often should creatives be refreshed?
- Do minor creative tweaks (updated voiceover, revised on-screen text) function like new creatives, or do they behave like the original?
- Is there value in running multiple TV creatives simultaneously, or is sequential rotation more efficient?
- Does TV investment for one brand create measurable lift for a related brand in the portfolio?
- At what point does additional TV investment stop reaching new audience and begin to saturate?
Each of these questions had direct budget implications. Each needed its own analytical approach. The full set of answers needed to land before annual planning meetings began.
Why Existing Methods Fall Short
Most TV measurement relies on one of three approaches: reach-and-frequency modeling against demographic audiences, agency-reported GRP delivery, or traditional MMM that aggregates TV into a single channel-level coefficient. None of these answers the questions the client actually had.
Reach-and-frequency tells you who saw the ad, not whether the ad drove behavior. GRP delivery confirms media ran as planned, but says nothing about effect. Traditional MMM can quantify TV's contribution to outcomes, but collapses creative-level differences into a single channel input — washing out exactly the variation needed to understand wear-out, creative overlap, and cross-brand halo effects.
What was needed was a framework that preserved creative-level granularity, accounted for time-based decay in creative impact, and modeled the interdependencies between related brands in the portfolio.
The Approach
I built a weekly regression framework that modeled branded paid search impressions as a function of TV activity, with additional structure layered on to answer each question.
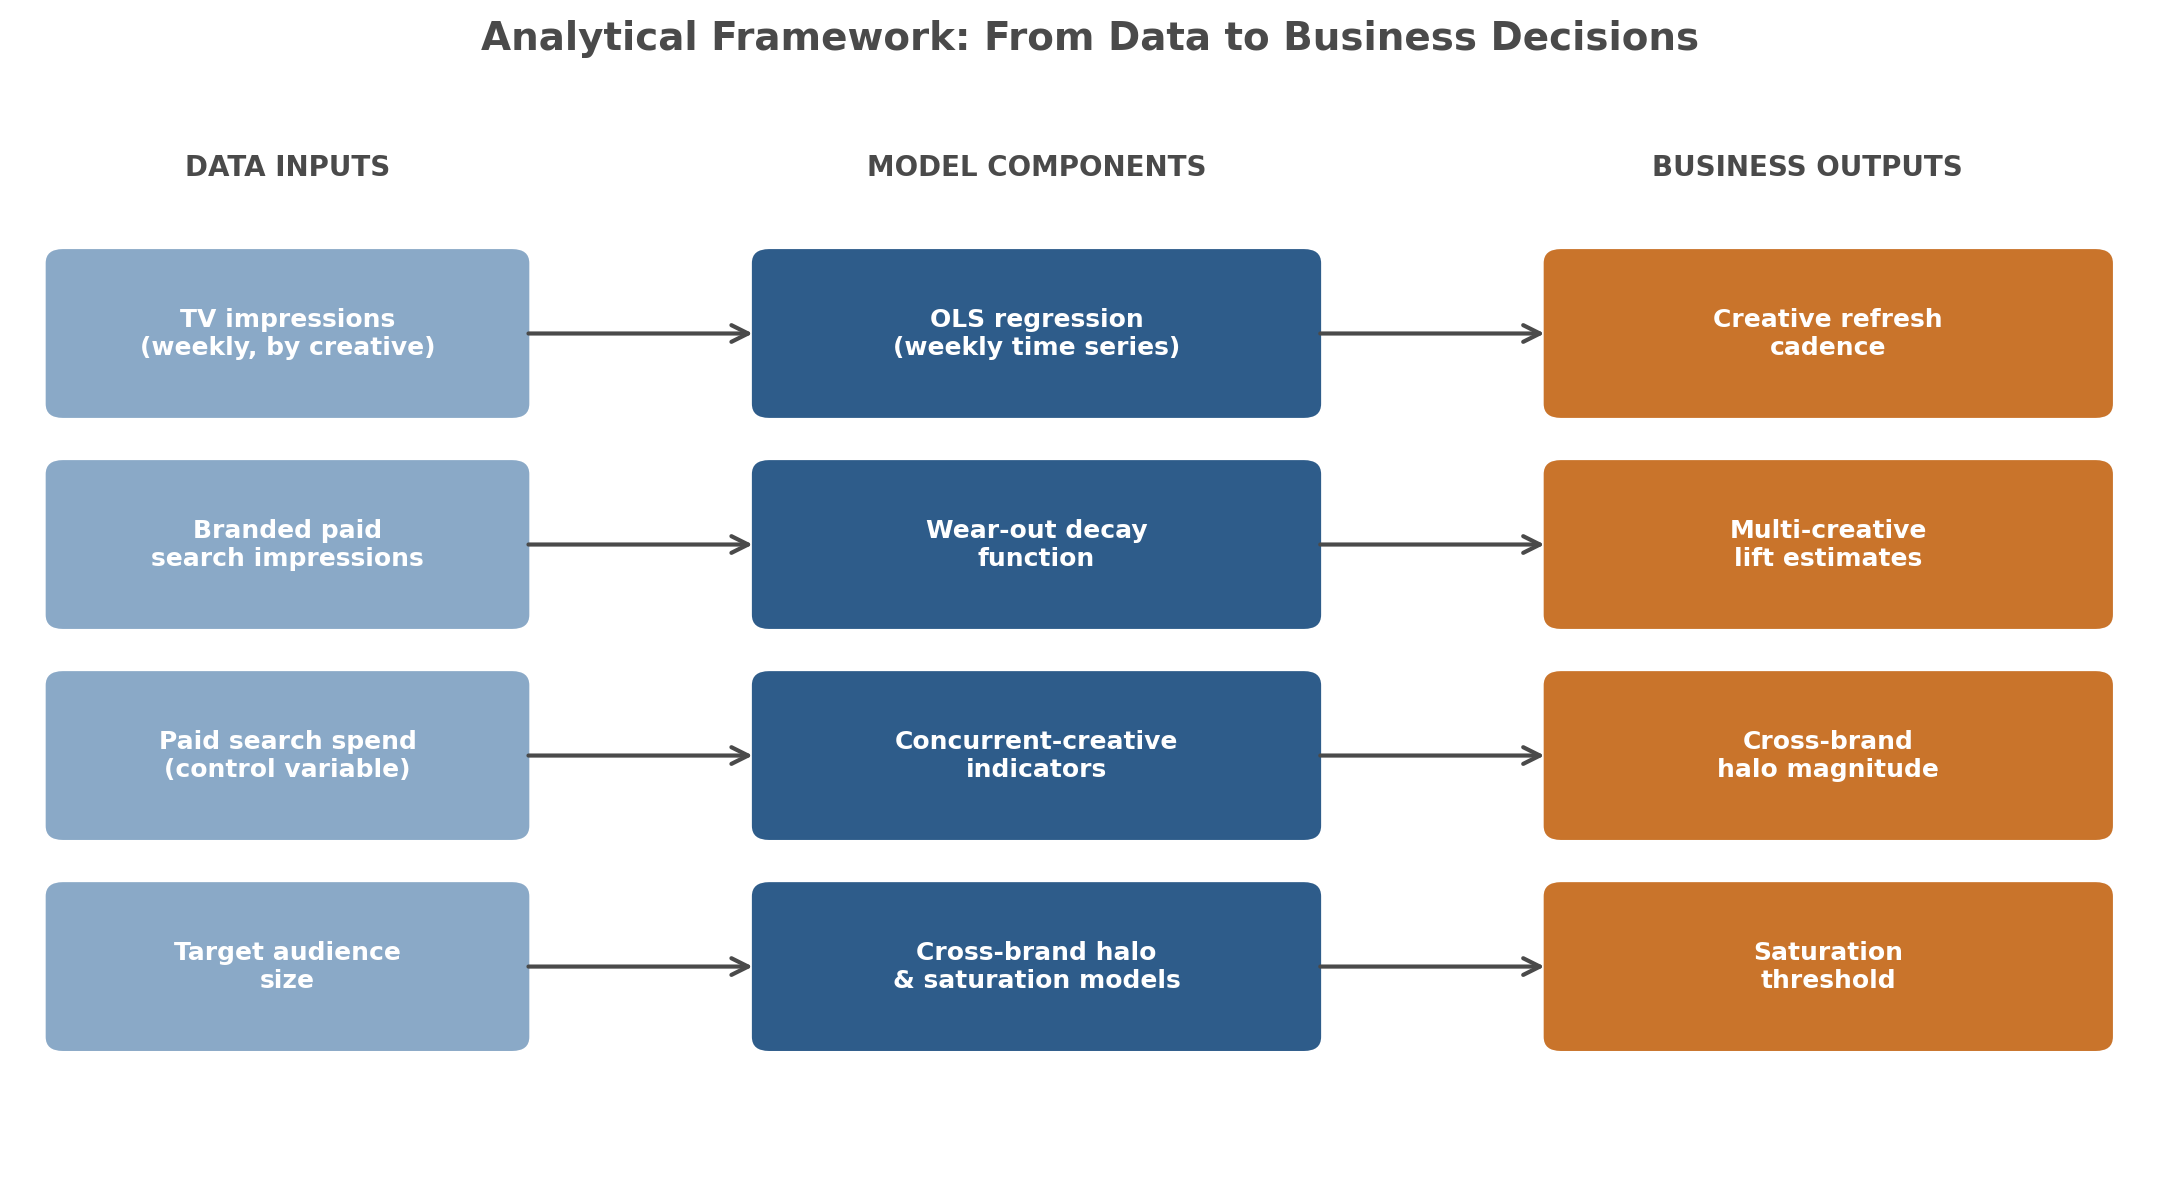
Data foundation. Three and a half years of weekly data, combining TV log data (impressions by creative, by brand) with branded paid search impressions. Paid search spend was included as a control to separate TV's effect from changes in search budget.
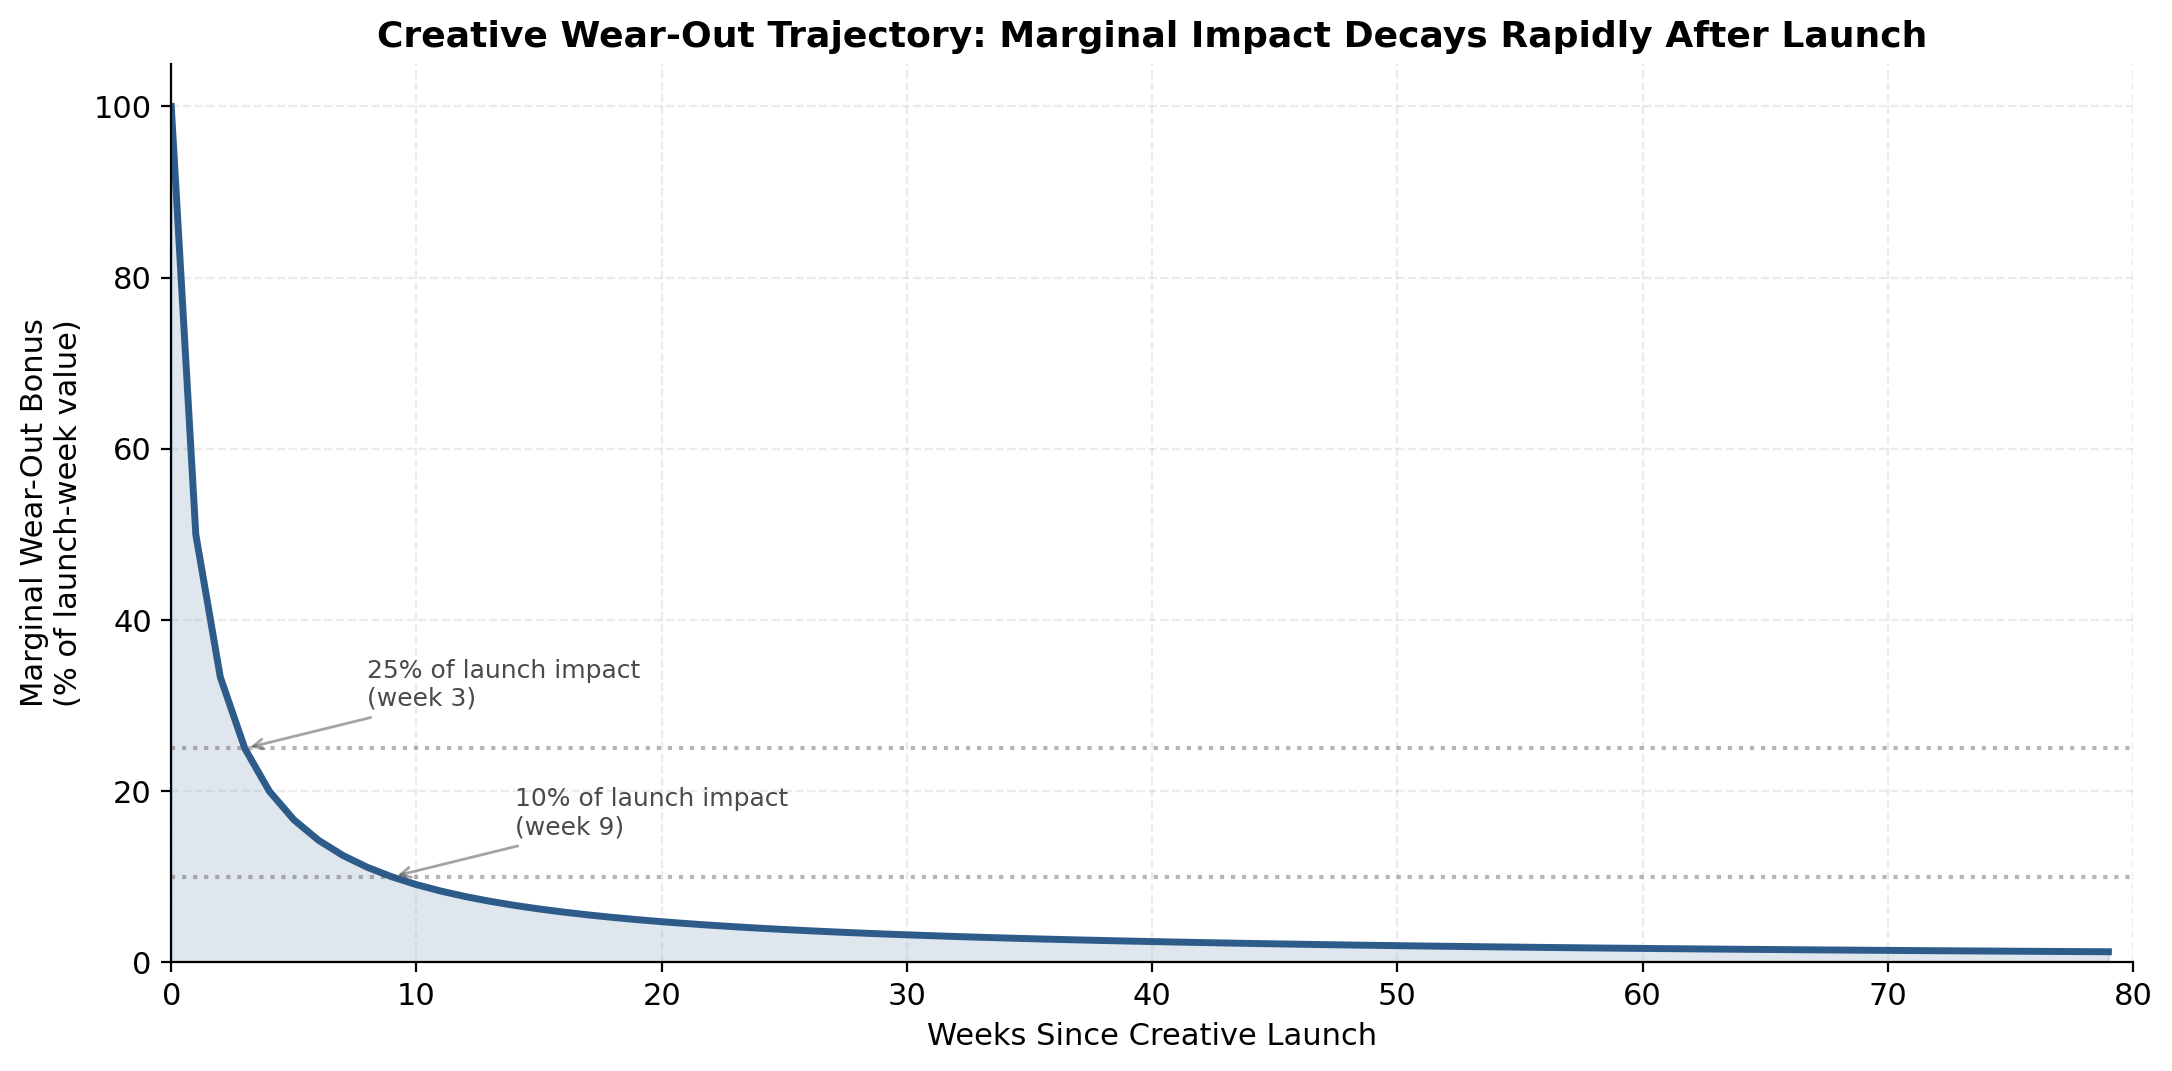
Custom wear-out function. Rather than treating each week's TV impressions as independent of creative age, I applied a per-creative wear-out bonus that decays as the creative ages. The function used was:
wear_out_bonus = 1 / (weeks_since_launch + 1)
This gives each creative a bonus of 1.0 in its launch week, dropping to 0.2 at week 4 and below 0.1 by week 10. Summed across all live creatives in a given week, the aggregate bonus captures the "newness premium" in the portfolio at that moment. The reciprocal form is deliberately parameter-free and front-loads the decay — appropriate given the empirically short window over which creatives retain novelty-driven response.
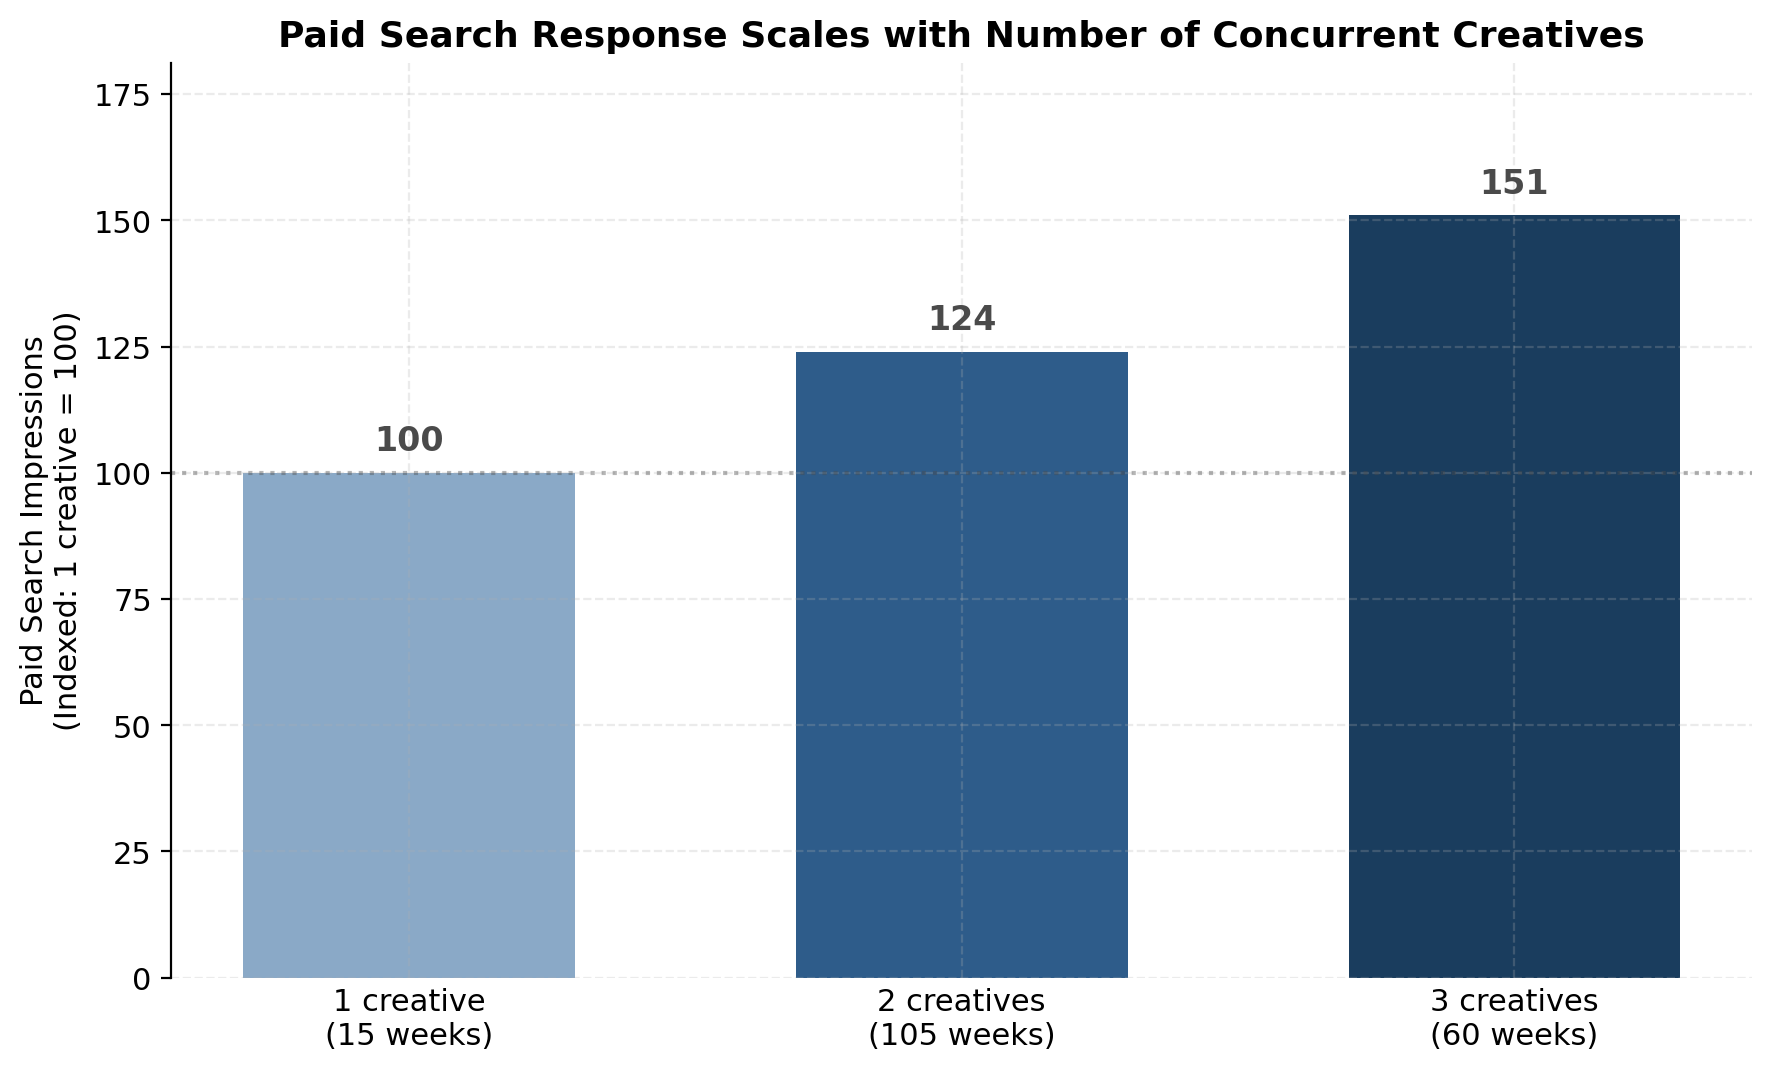
Concurrent-creative effects. Weekly counts of live creatives captured whether overlap between creatives compounds or cannibalizes paid search response.
Cross-brand halo modeling. Separate regression specifications tested whether TV activity for one brand in the portfolio drove branded paid search for a related brand — controlling for the related brand's own TV.
Saturation modeling. A separate model estimated the relationship between TV impressions and reach against the target audience, producing an upper bound on efficient TV investment — the point beyond which additional impressions stop reaching incremental audience.
Minor creative changes. Updated versions of existing creatives were tested as distinct units in the model. Where they showed no statistically significant difference from the original, the finding was that minor updates do not function as new creatives and should be modeled as part of the original.
Key Insights
TV drives branded paid search, and the relationship is strong. The weekly model showed that roughly half of the week-to-week variation in branded paid search impressions was explained by TV exposure and related controls — a strong direct effect, statistically significant. Branded search is a reliable proxy for TV-driven awareness and brand interest.
Creative marginal impact fades rapidly after launch. Under the wear-out framework, the marginal lift from a newly-launched creative drops below 25% of its launch-week value by week 3 and below 10% by week 10. The base TV impressions coefficient still applies — the creative continues to contribute — but the "newness premium" is effectively exhausted within the first quarter in market. This translates directly into a refresh cadence recommendation: plan for new creative to launch on a regular cycle so the portfolio always contains at least one creative contributing elevated marginal lift.
Running multiple creatives simultaneously compounds effect. Weeks with two active creatives generated a measurable lift in branded paid search over single-creative weeks. Weeks with three active creatives produced the largest lift observed. Sequential rotation — waiting for one creative to fully wear out before launching the next — leaves impact on the table. Continuous, overlapping launches maintain momentum.
Small creative tweaks do not reset the curve. Updates to voiceover or on-screen text, while the rest of the creative stayed the same, showed no statistically significant difference from the original. From a media planning perspective, these updates should be treated as extensions of the original creative, not as new launches.
Cross-brand halo is real and asymmetric. TV for one brand in the portfolio measurably lifted branded paid search for a related brand, at single-digit to low-double-digit percentage levels depending on direction. The halo was asymmetric — lift in one direction was meaningfully larger than the other — reflecting differences in audience reach and brand awareness at the time of measurement. This has direct implications for portfolio-level media strategy: investment in one brand is not isolated; it produces measurable spillover that should be factored into cross-brand budget allocation.
Saturation is quantifiable. The reach models produced a specific impression threshold at which additional TV stops reaching new audience. Planning TV investment at or below this level maximizes efficiency; planning above it produces diminishing returns on incremental spend.
Business Impact
The analysis was delivered ahead of the annual planning cycle. The findings informed the following year's plan in concrete ways:
TV allocation for existing brands was increased. The evidence of direct impact on branded paid search, combined with the quantified refresh cadence and multi-creative effects, supported expanded TV investment across the established portfolio.
A planned launch gained media investment based on the halo findings. A brand preparing for launch in the following year had been planned without a TV or video component. Based on the halo findings and the demonstrated relationship between TV and branded search, the launch plan was modified to include a new media investment that had not originally been funded.
Creative development cadence was formalized. The wear-out curve informed creative planning, ensuring new creative would launch on a cadence aligned with the fatigue curve rather than calendar convention.
The engagement scope grew. Because the analysis quantified the value of TV investment and identified a new channel for a planned launch, the client's overall media investment expanded. What began as a measurement question became a driver of incremental business.
Why This Matters
Most TV measurement stops at "did it work." This approach asks harder questions — when does it stop working, what happens when we layer creatives, does one brand help another — and answers them at the level of specificity budget decisions actually require.
For a multi-brand portfolio, treating each brand's media in isolation leaves halo effects unmeasured and portfolio-level optimization out of reach. Treating all TV as a single channel input loses the creative-level variation that drives planning decisions about refresh timing and concurrent launches. Neither shortcut produces the analysis a CMO or media strategy lead can use to defend an annual plan.
The framework is reusable. It's designed to be rerun as new data comes in, extended to include additional channels, and integrated with alternative data sources as they become available. Each rerun refines the wear-out curve, updates the halo estimates, and sharpens the saturation bounds — turning a point-in-time analysis into a continuous measurement capability.
Implementation
This methodology was implemented in Python, using weekly time-series regression with a custom wear-out decay function. A companion notebook demonstrating the wear-out and cross-brand halo components of this methodology — using synthetic data and generic labels — is available on GitHub. The notebook is intended as a methodology demonstration; the values it produces are illustrative and do not represent real-world engagement results.